loadingExperience directly from the PSI API with a fallback to originLoadingExperienceI ran a 205-page Screaming Frog PSI audit on a client site with all CrUX Metrics settings enabled. Every page-level CrUX column in the export was blank. Zero page-level field data across the entire site. Google Search Console showed Core Web Vitals: Failed for the same site.
Both were correct. That’s the problem, and it has two causes, not one.
The Google PageSpeed Insights API returns two data sets in a single response:
Lighthouse (lab data) lives in lighthouseResult. It is a simulated page load on a controlled test device with a throttled connection. It produces the Performance Score (0 to 100) and lab measurements of LCP, FCP, TBT, Speed Index, and CLS. It is useful for diagnosing technical issues. It is not what Google uses for rankings.
CrUX (field data) lives in loadingExperience (page-level) and originLoadingExperience (domain-level). It is aggregated from real Chrome users over the last 28 days, measured at the 75th percentile. It produces real LCP, real INP, real CLS, and the overall Core Web Vitals Assessment: FAST (pass), AVERAGE, or SLOW (fail). This is what Google uses for rankings.
Google’s documentation states: “Field data is historical performance data about a URL collected from real users in the field… Lab data is performance data collected within a controlled environment.”
A page can score 95 in Lighthouse and still fail Core Web Vitals. The two numbers are independent.
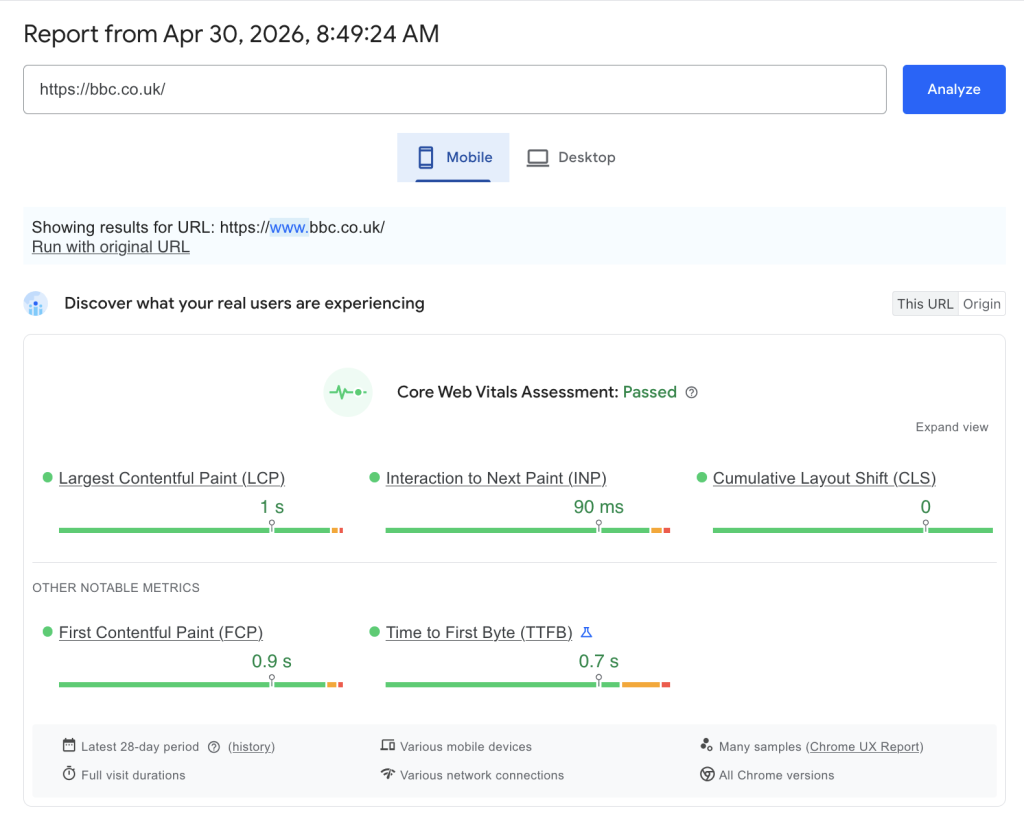
[Screenshot: PageSpeed Insights for bbc.co.uk, the “Discover what your real users are experiencing” section. Shows: Core Web Vitals Assessment: Passed, LCP 1s, INP 90ms, CLS 0, sourced from the Chrome UX Report, latest 28-day period.]
Screaming Frog does support CrUX data export, but it requires a manual configuration step.
Go to: Crawl Config > API Access > PageSpeed Insights > Metrics tab
There you will see metric groups you can enable or disable: Overview, CrUX Metrics, Lighthouse Metrics, Insights, Diagnostics, Mobile Friendly, and Accessibility. CrUX Metrics is not checked by default. Until you enable it, Screaming Frog exports Lighthouse data only. All CrUX columns in your output will be empty regardless of how much traffic the site receives.
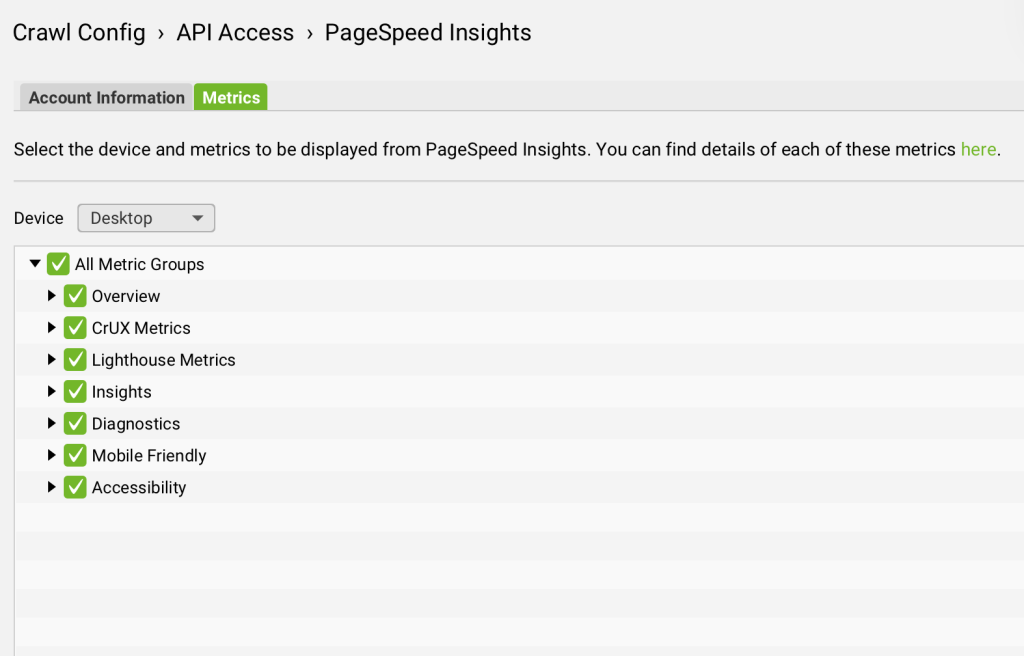
Enable CrUX Metrics before every PSI crawl. Without it you are auditing Lighthouse data and calling it Core Web Vitals.
This is where many people get stuck. You tick every box, rerun the crawl, and the page-level CrUX columns are still blank.
This is not a Screaming Frog bug. It is a Google data availability issue.
Google’s CrUX dataset requires a minimum number of real Chrome visits to a URL in the last 28 days before that URL appears at the page level. For lower-traffic pages, blog posts, regional subfolders, and most inner pages on B2B sites, that threshold is simply not met.
In my 205-page audit, with all CrUX Metrics enabled, page-level CrUX data was zero across every single URL. The site did not have enough per-page traffic to appear in Google’s page-level CrUX dataset.
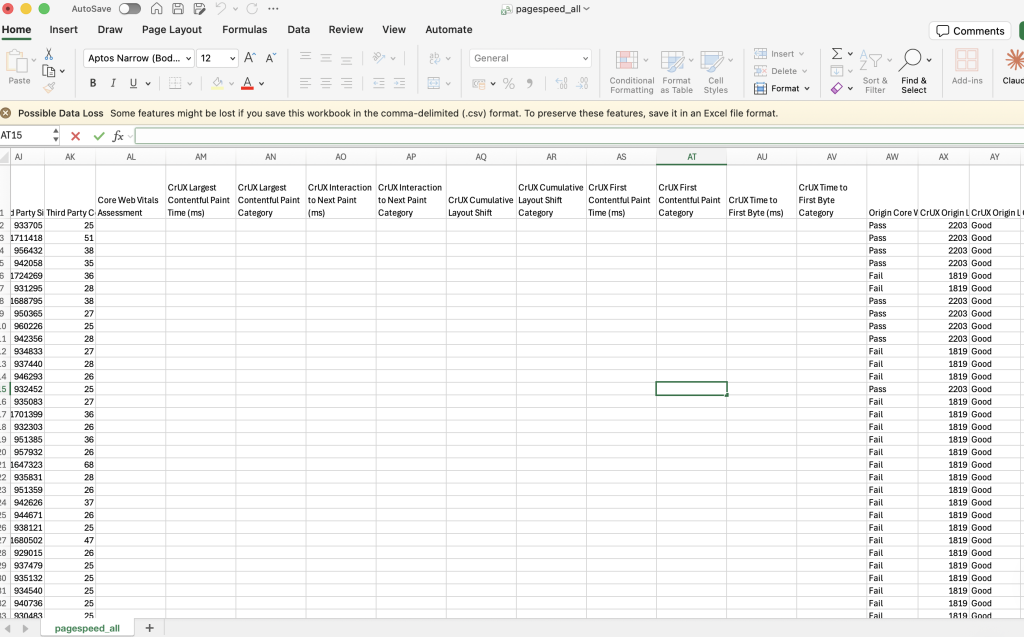
When page-level CrUX is unavailable, Screaming Frog falls back to originLoadingExperience, which is domain-level field data aggregated across all Chrome users visiting any page on that origin.
With all settings enabled, origin-level CrUX populated for 100% of the 205 pages in my audit. The data was there. It just was not telling me about individual pages. It was telling me about the domain as a whole.
The important nuance: origin-level data is the same value repeated for every URL in the export that shares the same origin. It tells you whether the site is broadly passing or failing Core Web Vitals, but it cannot tell you which specific pages are responsible.
In the 205-page audit, origin-level CrUX showed 196 pages failing and 9 passing. But those 9 passing pages are on a different origin profile with different infrastructure, not because those specific pages individually perform better.
Interaction to Next Paint replaced First Input Delay as a Core Web Vital in March 2024. It measures page responsiveness to user interaction and is now one of the three metrics that determine CWV pass/fail.
INP only exists in CrUX field data. There is no Lighthouse equivalent. A simulated page load cannot measure real user interaction.
If CrUX Metrics is not enabled, you have no INP data. If page-level CrUX is blank due to the traffic threshold, you have only origin-level INP, which is a domain average, not a per-page reading.
The 205-page audit illustrates this clearly.
Lighthouse (lab data) showed a mean LCP of 2.2s across the site, with 189 pages rated Good. On the surface that looks reasonable. But the homepage Lighthouse LCP was 45.6 seconds, driven by a 20MB hero image. Real users experience something much faster because of CDN caching. The lab test hits the origin server cold.
Origin-level CrUX showed a completely different picture: real users experienced LCP at 1,819ms to 2,203ms depending on which origin served the page, and 196 of 205 pages were failing Core Web Vitals at the domain level.
Same site. Same audit. Lab data says mostly good. Real user data says mostly failing.
This is why reading both layers matters, and why treating the Lighthouse score as a proxy for Core Web Vitals status is a mistake.
For per-page CWV coverage regardless of traffic threshold, query the API directly:
const apiKey = 'YOUR_API_KEY';
const url = 'https://www.bbc.co.uk/';
const endpoint = `https://www.googleapis.com/pagespeedonline/v5/runPagespeed?url=${encodeURIComponent(url)}&key=${apiKey}&strategy=desktop`;

const res = await fetch(endpoint);
const data = await res.json();

// CrUX field data: real users, what Google measures
// Falls back to origin-level if page-level data is not available
const field = data.loadingExperience?.metrics
  ? data.loadingExperience
  : data.originLoadingExperience;

console.log('CWV Assessment:', field.overall_category);
// FAST = pass, AVERAGE = borderline, SLOW = fail

console.log('LCP:', field.metrics.LARGEST_CONTENTFUL_PAINT_MS?.percentile, 'ms');
console.log('LCP category:', field.metrics.LARGEST_CONTENTFUL_PAINT_MS?.category);

console.log('INP:', field.metrics.INTERACTION_TO_NEXT_PAINT?.percentile, 'ms');
console.log('INP category:', field.metrics.INTERACTION_TO_NEXT_PAINT?.category);

console.log('CLS:', field.metrics.CUMULATIVE_LAYOUT_SHIFT_SCORE?.percentile);
console.log('CLS category:', field.metrics.CUMULATIVE_LAYOUT_SHIFT_SCORE?.category);

// Lighthouse score: useful for diagnosis, not a ranking signal
const labScore = data.lighthouseResult.categories.performance.score * 100;
console.log('Lighthouse score:', labScore);
If overall_category comes back as SLOW, the site is failing Core Web Vitals. The Lighthouse score is irrelevant to that result.
Three sources, three jobs:
loadingExperience for the homepage and key commercial templates, with a fallback to originLoadingExperience. This gives you real INP and real CWV pass/fail status for any page, regardless of traffic volume.None of these alone gives the full picture. All three together do.
My AI-powered audit platform, LLM Scout, was initially making the same mistake: the extractPsiVitals() function read only from lighthouseResult. After my analyst flagged the discrepancy, I shipped a dedicated extractCruxFieldData() function that reads the right API branch with origin-level fallback built in:
function extractCruxFieldData(data) {
  const field = data.loadingExperience?.metrics
    ? data.loadingExperience
    : data.originLoadingExperience;

  if (!field?.metrics) return null;

  return {
    overall_category: field.overall_category,
    lcp: {
      value: field.metrics.LARGEST_CONTENTFUL_PAINT_MS?.percentile,
      category: field.metrics.LARGEST_CONTENTFUL_PAINT_MS?.category,
    },
    inp: {
      value: field.metrics.INTERACTION_TO_NEXT_PAINT?.percentile,
      category: field.metrics.INTERACTION_TO_NEXT_PAINT?.category,
    },
    cls: {
      value: field.metrics.CUMULATIVE_LAYOUT_SHIFT_SCORE?.percentile,
      category: field.metrics.CUMULATIVE_LAYOUT_SHIFT_SCORE?.category,
    },
    fcp: {
      value: field.metrics.FIRST_CONTENTFUL_PAINT_MS?.percentile,
      category: field.metrics.FIRST_CONTENTFUL_PAINT_MS?.category,
    },
    ttfb: {
      value: field.metrics.EXPERIMENTAL_TIME_TO_FIRST_BYTE?.percentile,
      category: field.metrics.EXPERIMENTAL_TIME_TO_FIRST_BYTE?.category,
    },
  };
}
The LLM Scout UI now shows two distinct layers per page: a CWV badge (Passed / Needs Work / Failed) driven by CrUX field data, real-user LCP, INP, and CLS with FAST / AVERAGE / SLOW ratings, and the Lighthouse score separately beneath it. The two are never conflated.
Yes, but “CrUX Metrics” is not enabled by default. Go to Crawl Config > API Access > PageSpeed Insights > Metrics tab and check it before running your crawl.
Google’s CrUX dataset requires a minimum traffic threshold before a URL appears at page level. Most inner pages on B2B and lower-traffic sites will not meet that threshold. In a 205-page audit with all settings enabled, I had zero page-level CrUX data across the entire site. This is a Google data availability issue, not a Screaming Frog bug.
Yes, when CrUX Metrics is enabled. The origin columns (CrUX Origin LCP, CrUX Origin INP, etc.) will populate for every URL, giving you domain-level field data as a fallback. It is the same value repeated for all URLs on the same origin.
Only via the origin-level columns, and only when CrUX Metrics is enabled. There is no Lighthouse version of INP. Page-level INP from Screaming Frog will be blank on most sites.
Lighthouse score (0 to 100) is a composite of lab metrics from a simulated load. Core Web Vitals Assessment (Pass/Fail) is based on real Chrome user data from the last 28 days. Google uses the second one as a ranking signal, not the first. A site can look healthy in Lighthouse and be failing CWV entirely.
Google Search Console, Core Web Vitals report. It shows origin-level CrUX by device, grouped by status, and is updated regularly.